

The Membrane Dashboard
The dashboard is a customizable interface for viewing data and executing repetitive workflows. With the dashboard, you can quickly build utilitarian UIs on top of your Membrane programs.
In the video above, we add blocks to the dashboard representing a GitHub user, repo, and issue. Those particular views are defined in membrane/github, but you can create and compose your own views to solve your needs.
We’ll get to creating views, but let’s start with the basics of using the dashboard.
Using the dashboard
Section titled “Using the dashboard”Opening
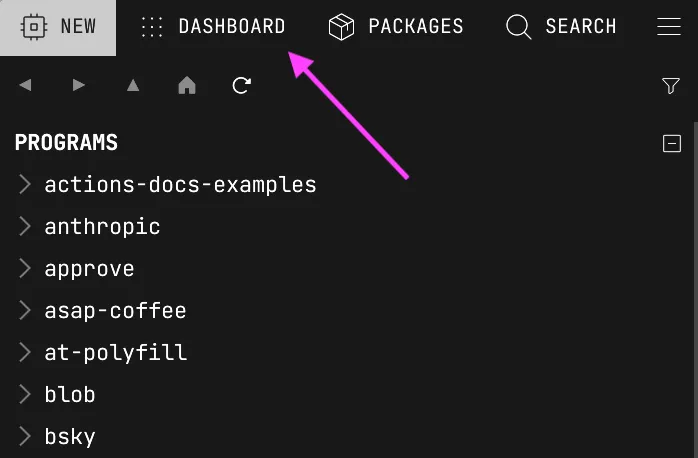
Section titled “Opening”To open the dashboard, click DASHBOARD in the top left of your editor.
Installing
Section titled “Installing”If you haven’t already, install the membrane/dashboard package. This program will track the blocks you add to the dashboard and their position. Now you’re ready to add stuff!
Adding blocks
Section titled “Adding blocks”To add a block to your dashboard, simply drag ‘n drop a gref onto the dashboard.
If the gref’s node type does not yet have a custom view, select “CREATE CUSTOM VIEW” to make one. Or explore the node’s fields, actions, and events by clicking “SHOW EXPLORER.”
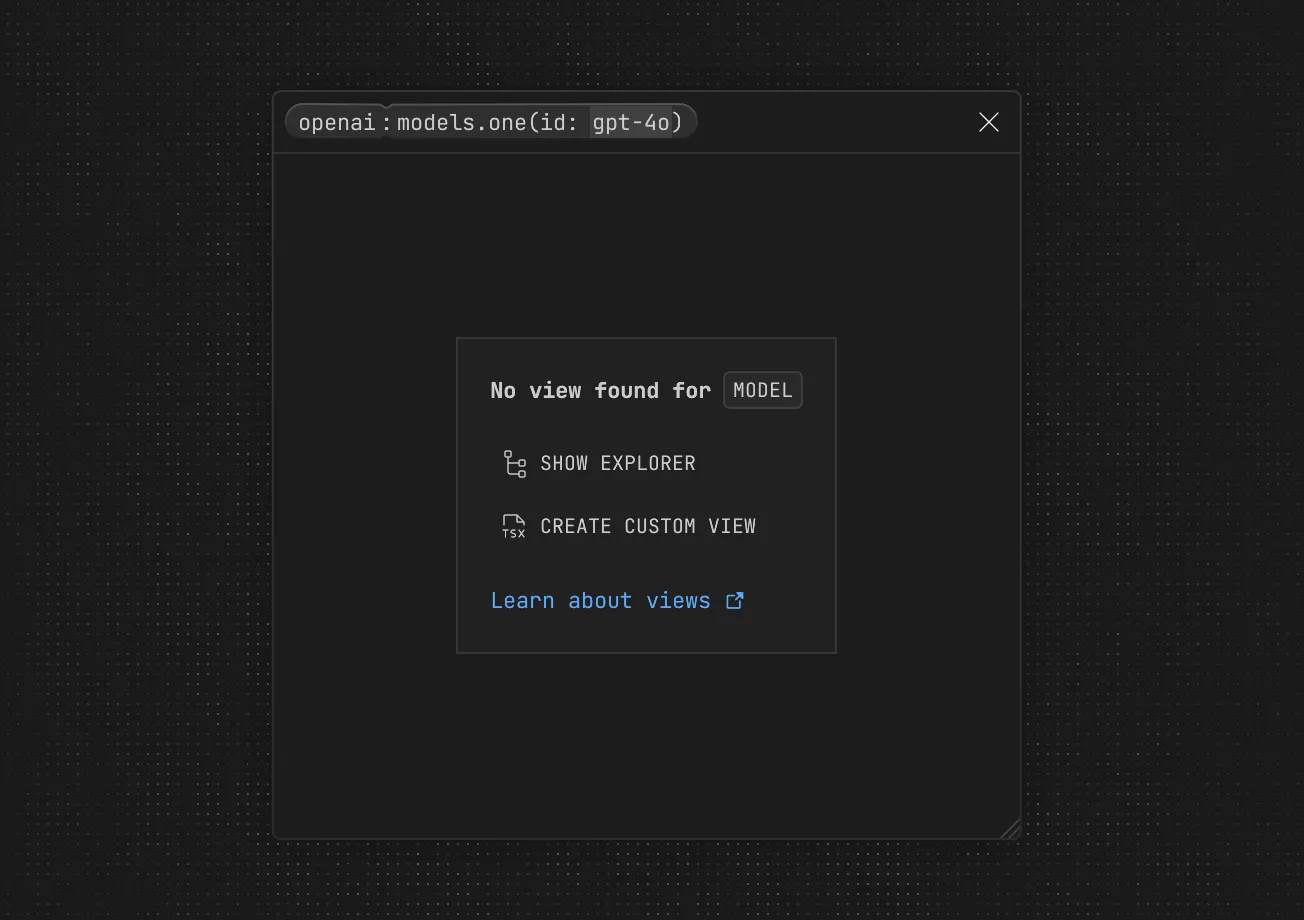
We cover creating and generating custom views below, but first let’s discuss organizing and navigating around the dashboard.
Moving around
Section titled “Moving around”To use the dashboard fluidly, run through this checklist:
- Move a block by dragging and dropping. The dashboard grid is intentionally coarse. Blocks are sized and positioned in 128px increments.
- Resize a block by dragging from its bottom right corner.
- Pan by scrolling with your mouse or trackpad. Press
shiftto scroll horizontally. Alternatively, middle click (scroll wheel) with your mouse and drag the dashboard background to pan. - Fullscreen. Toggle by clicking the fullscreen icon button in the top right corner of the dashboard.
- Picker mode. Press
spaceor click the dashboard background to zoom out, then click a block to focus it or press space/click again to zoom in on your mouse position. You can also holdctrl|commandand scroll to activate picker mode. - Stacked mode. Selecting a gref embedded in another view will activate a breadcrumb-like horizontally stacked view, allowing exploration of nested data. Drag a gref from a stack column to persist as its own block. Click outside of the columns or press escape to exit stacked mode. Hold
shiftto see all elements with an explorable gref,shift+clickto open stacked mode, andshift+rightclickfor more options (copy gref, copy value, etc). - Explore mode. Click “EXPLORE” in the top left corner of the dashboard, or right-click on the dashboard background and select “Explore Graph” to explore your program graph. Explore mode works like stack mode, allowing you to view nested nodes and peel/drag one off to place it on your board.
- Inspect elements by holding
cmd+shiftand hovering to see the corresponding code in views.tsx. Click the element while holdingcmd+shiftto:- Select the relevant code in views.tsx
- Set the fragment context for Brane, allowing you to ask about or modify that specific code element without having to manually select it
Here’s a demo of each movement described above:
Managing boards
Section titled “Managing boards”Boards are dashboard pages for organizing your blocks. Just as spreadsheets have sheets, the dashboard has boards. You might have a board for customer support and another for ad hoc Stripe actions, for example.
When the dashboard is open, you’ll see the name of the current board in the top middle of the dashboard. Click on it to view, switch, and create new boards:
Boards and blocks are persisted in the dashboard program’s state. See membrane/dashboard‘s readme to learn more about how boards and blocks are implemented.
Creating views
Section titled “Creating views”In this section, we’ll explain how to create dashboard views by hand.
Custom views correspond to node types in a program. So if your program has a User type, you could create a custom User view that displays select fields (like name and email) and exposes an action (e.g. disable). Whenever you drop a gref of type User onto the dashboard, it will use the User view you created for that block.
views.tsx
Section titled “views.tsx”First, create a views.tsx file in any Membrane program (views.jsx works, too). To create a view for a type, export a function (or arrow function——dealer’s choice) by the same name from views.tsx. E.g. for a User type, we export a User view:
export function User({ self, compact }) {  if (compact) {    return <row>{self.email}</row>  }
  return (    <col>      <row>        <text style={{ fontSize: "large" }}>{self.name}</text>      </row>      <row>        <text>{self.email}</text>      </row>      <row>        <button action={self.disable}>Disable account</button>      </row>    </col>  )}
View functions receive an object parameter with a self property, which is a reference to the node. So this User view would have access to all fields, actions, and events on the User type. Views also receive a compact prop, which defaults to true when rendering collections and can be passed manually to embeds.
The dashboard uses a Membrane-specific flavor of JSX. For full coverage of valid elements and styles, read our JSX reference.
Generating views
Section titled “Generating views”While you can always write views by hand, it’s usually more practical to generate a view in a matter of seconds. Just ask Brane to generate a view for a particular type, or for many types in a program.
Once Brane spits out your view(s), use the generated code as a starting point or ask Brane to iterate. Or rely on inline editor completions as a middle ground between crafting by hand and full generation.
How the dashboard works
Section titled “How the dashboard works”As you may have noticed, dashboard is itself a Membrane program, membrane/dashboard, that works in tandem with system code.
The program has actions to put, move, remove, and rename blocks. It uses state to store blocks you’ve added with some data and metadata for each block. It also stores boards in program state. You can read through the program readme to learn more.
The canvas-like dashboard UI is implemented using JSX and Rust compiled to WASM. If you inspect the page via browser devtools, you’ll see an HTML <canvas> wherein we run the compiled Rust code. We use a frontend Rust framework called egui along with a flexbox layout crate taffy. The full cycle is JSX to JSON to Rust to WASM.
The code you write or generate in views.tsx uses custom Membrane JSX. See our reference page to see which elements and props are available.